Missing data in the subdaily model
Run this notebook
Read the guide on setting up your computer to run Jupyter notebooks
Download
this notebookas a Jupyter notebook.
The acclimation process in the subdaily model uses a weighted mean of the daily acclimation conditions with preceding daily conditions. When there are missing data, this results in problems in the estimation of the realised daily values for \(\xi\), \(V_{cmax25}\) and \(J_{max25}\).
The key problem is if there are missing values in the observations set as the acclimation window for the subdaily model. The daily optimal behaviour for the plant is calculated using the average values of forcing variables within the window and missing values within the window will lead to the average value also being missing. This propagates through the weighted mean process - all days following the missing data will also be missing.
The subdaily model provides two options to help deal with missing data.
The acclimation process can be set to allow partial acclimation data in the calculation of daily average values by ignoring missing data and taking the average of the available observations (
allow_partial_data).However, allowing partial data cannot solve the issue where the forcing data is missing throughout the acclimation window for a day or where the P Model calculations are undefined throughout that window on a day. Both of these cases give a missing value in the time series of daily optimal values, which would then be propagated through the calculation of realised values using weighted averages.
Hence the second option is to allow the iterated calculation of daily realised values to hold over the last valid value until the next valid daily optimal value is found (
allow_holdover). Note that this cannot fill missing values at the start of time series.
The code below gives a concrete example - a time series that starts and ends during in the middle of a one hour acclimation window around noon. Only two of the three observations are provided for the first and last day
from copy import copy

import numpy as np
import matplotlib.pyplot as plt
from matplotlib.patches import Rectangle, Patch
import matplotlib.dates as mdates

from pyrealm.pmodel.acclimation import AcclimationModel

# A five day time series running from noon until midnight
datetimes = np.arange(
    np.datetime64("2012-05-01 00:00"),
    np.datetime64("2012-05-05 23:30"),
    np.timedelta64(30, "m"),
)

# Example data with missing values
scale_trig = (60 * 24) / (2 * np.pi)
amplitude = 5
trend = 5
complete_data = np.round(
    (-amplitude * np.cos((datetimes - datetimes[0]).astype(np.float64) / scale_trig))
    + amplitude,
    2,
) + np.linspace(0, trend, len(datetimes))

data = complete_data.copy()

data[datetimes <= np.datetime64("2012-05-01 15:30")] = np.nan
data[
    np.logical_and(
        datetimes >= np.datetime64("2012-05-03 11:00"),
        datetimes <= np.datetime64("2012-05-03 13:00"),
    )
] = np.nan
data[
    np.logical_and(
        datetimes >= np.datetime64("2012-05-04 09:30"),
        datetimes <= np.datetime64("2012-05-04 15:30"),
    )
] = np.nan


# Create a first default acclimation model
acclim_model = AcclimationModel(datetimes)

window_center = np.timedelta64(12, "h")
half_width = np.timedelta64(150, "m")

acclim_model.set_window(window_center=window_center, half_width=half_width)
The get_window_values() method
extracts the values within the acclimation window for each day. With the half hourly
data and the window set above, these are the observations at 11:30, 12:00 and 12:30.
This method is typically used internally and not directly by users, but it shows the
problem of the missing data clearly:
The 11:30 observation is ‘missing’ on the first day because the data start at 12:00.
The 12:00 and 12:30 observations are ‘missing’ on the last day because the data ends at 11:30.
One day has a single missing 12:00 data point within the acclimation window.
One day has no data within the acclimation window.
fig, ax = plt.subplots()

# Add the acclimation windows for each day
acclim_windows = [
    Rectangle(
        (win_center - half_width, 0),
        2 * half_width,
        2 * amplitude + trend,
        facecolor="salmon",
        alpha=0.3,
    )
    for win_center in acclim_model.sample_datetimes_mean
]

[ax.add_patch(copy(p)) for p in acclim_windows]

ax.plot(datetimes, complete_data, color="grey", linewidth=0.5, linestyle="dashed")
ax.plot(datetimes, data, marker=".")

# Format date axis
myFmt = mdates.DateFormatter("%m/%d\n%H:%M")
_ = ax.xaxis.set_major_formatter(myFmt)
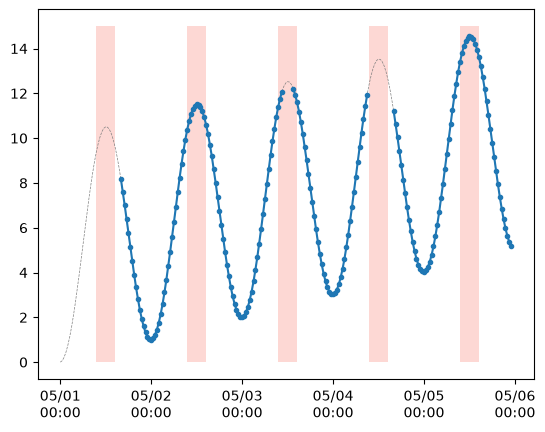
acclim_model.get_window_values(data).round(1)
array([[ nan,  nan,  nan,  nan,  nan,  nan,  nan,  nan,  nan,  nan,  nan],
       [10.4, 10.8, 11.1, 11.3, 11.5, 11.5, 11.5, 11.4, 11.2, 10.9, 10.6],
       [11.4, 11.8, 12.1,  nan,  nan,  nan,  nan,  nan, 12.2, 11.9, 11.6],
       [ nan,  nan,  nan,  nan,  nan,  nan,  nan,  nan,  nan,  nan,  nan],
       [13.4, 13.8, 14.1, 14.3, 14.5, 14.5, 14.5, 14.4, 14.2, 14. , 13.6]])
The daily average conditions are calculated using the
get_daily_means() method. If
partial data are not allowed - which is the default - the daily average conditions for
all days with missing data is also missing (np.nan).
partial_not_allowed = acclim_model.get_daily_means(data)
partial_not_allowed.round(2)
array([ nan, 11.1 , nan, nan, 14.12])
Using an acclimation model that sets allow_partial_data = True allows the daily
average conditions to be calculated from the partial available information. This does
not solve the problem for days with no data in the acclimation window, which still
results in a missing value and also generates a warning.
# Create an acclimation model that allows partial data
acclim_model_partial = AcclimationModel(datetimes, allow_partial_data=True)
acclim_model_partial.set_window(window_center=window_center, half_width=half_width)

partial_allowed = acclim_model_partial.get_daily_means(data)
partial_allowed.round(2)
/home/docs/checkouts/readthedocs.org/user_builds/pyrealm/checkouts/latest/pyrealm/pmodel/acclimation.py:518: RuntimeWarning: Mean of empty slice
  return np.nanmean(daily_values, axis=1)
array([ nan, 11.1 , 11.83, nan, 14.12])
The apply_acclimation() method is
used to calculate realised acclimated values of a variable from the optimal values. By
default, this function will raise an error when missing data are present:
try:
    acclim_model_partial.apply_acclimation(partial_not_allowed)
except ValueError as excep:
    print("Error message: ", excep)
Error message: Missing data in input values, try setting allow_holdover=True
Using an acclimation model set with allow_holdover=True allows the function to be run.
If the input to apply_acclimation does not allow partial data, then the gaps on day
3 and 4 are filled by holding over the value from day 2.
acclim_model_partial_and_holdover = AcclimationModel(datetimes, allow_holdover=True)
acclim_model_partial_and_holdover.set_window(
    window_center=window_center, half_width=half_width
)

acclim_model_partial_and_holdover.apply_acclimation(partial_not_allowed).round(3)
array([ nan, 11.096, 11.096, 11.096, 11.298])
When partial data is allowed, the allow_holdover uses the value estimated from partial
data on day 3 to fill the completely missing data on day 4.
acclim_model_partial_and_holdover.apply_acclimation(partial_allowed).round(3)
array([ nan, 11.096, 11.145, 11.145, 11.343])
These options do not fix all problems, such as the gap on day 1 that cannot be filled by holding over earlier values. The best way forward depends partly on the source of the missing data and how common it is, as discussed below.
Sources of missing data
There are three ways that missing data can occur:
Simple data gaps
Your data might simply be incomplete and have missing data through the time series. Note that the main problems only arise if you have missing data during the acclimation window, because this prevents the calculation of the realised values of \(\xi\), \(V_{cmax25}\) and \(J_{max25}\) at the subdaily time scale. Missing values at other points in the daily cycle simply lead to missing predictions at individual observations.
You can fix this problem in a few ways:
With sparse missing data, you may be able to simply use the
allow_partial_dataoption to ignore the missing data when calculating daily means.However if any day has no valid data during the acclimation window for a variable, then the partial data calculation will still result in missing data in the daily average values. The optimal behaviour for the day cannot be calculated and hence the realised values cannot be calculated. In this case, the
allow_holdoveroption may help resolve the problem.It may also be easier to interpolate your missing data, possibly using methods from the
scipy.interpolatemodule, and avoid having to use these options.
Incomplete start and end days
It is common for observation data to start or end part way through a day, often as a result of converting UTC times to local time. If the observations on the first and last day only partly cover the acclimation window, then there is effectively missing acclimation data.
The
allow_holdoveroption will skip over the first day - you will not get predictions until the following day, but then the rest of the calculations will continue as normal.The
allow_partial_datawill allow the estimation of optimal values on the first and last days and extend the predictions to the start of the data.You could also simply truncate the data to complete days or extrapolate the data to fill in the missing start and/or end observations.
Undefined behaviour in the P Model
Two critical variables in the P Model (\(V_{cmax}\) and \(J_{max}\)) are not estimable under
some environmental conditions (see
OptimalChiPrentice14 for the details). As a result,
even with complete forcing data, the P Model can generate undefined values as part of
the calculation of optimal \(\chi\). Under these conditions, missing values arise in the
daily model of optimal behaviour and the allow_holdover=Trueoption is required to
generate predictions.