Isotopic discrimination
Run this notebook
Read the guide on setting up your computer to run Jupyter notebooks
Download
this notebookas a Jupyter notebook.
C3 and C4 plants assimilate the heavier atmospheric \(\ce{^{13}CO2}\) and \(\ce{^{14}CO2}\) molecules less easily than \(\ce{^{12}CO2}\), leading to a discrimination against carbon 13 and carbon 14 and alteration of the resulting isotopic composition of plant tissues. The isotopic discrimination and associated isotopic composition of a plant material depends on the photosynthetic pathway.
The pmodel module provides the
CarbonIsotopes class, which takes the predicted
optimal chi (\(\chi\)) and photosynthetic pathway from a fitted
PModel instance and predicts various isotopic
discrimination and composition values.
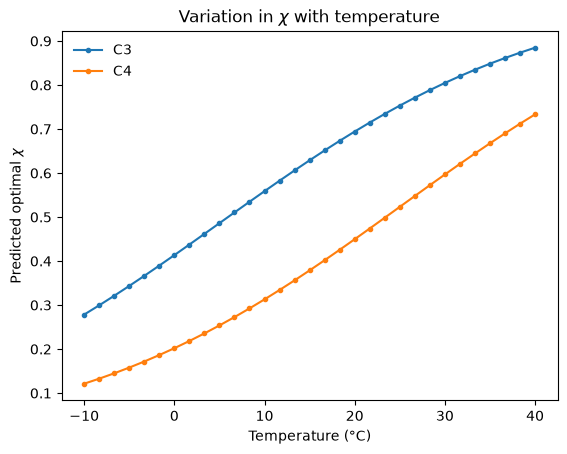
The predictions from the CarbonIsotopes class are
driven by variation in \(\chi\). The examples below show predictions across a range of
values of \(\chi\). The sequence of \(\chi\) values used is created by using the P Model to
estimate \(\chi\) across a temperature gradient, giving the range of \(\chi\) values shown
below for C3 and C4 plants.
/home/docs/checkouts/readthedocs.org/user_builds/pyrealm/checkouts/latest/pyrealm/pmodel/pmodel.py:481: UserWarning:
            The default value for quantum yield of photosynthesis (phi0=1/8) has changed
            since pyrealm 1.0.0. You may need to change settings to duplicate results
            from pyrealm 1.0.0.

  warn(
Calculation of values
The CarbonIsotopes class takes a
PModel instance, along with estimates of the atmospheric
isotopic ratios for Carbon 13 (\(\delta13C\), permil) and Carbon 14 (\(\Delta14C\), permil)
and calculates the following predictions:
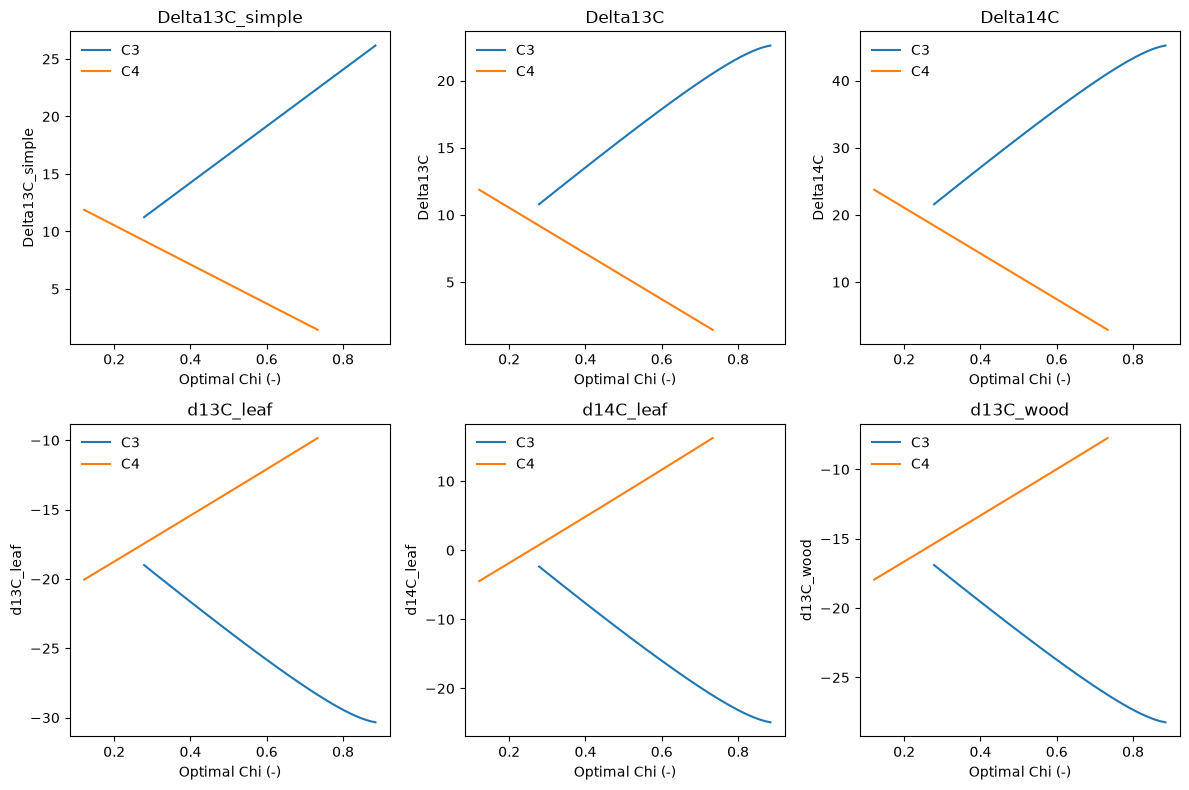
Delta13C_simple: discrimination against carbon 13 (\(\Delta\ce{^{13}C}\), permil) excluding photorespiration.Delta13C: discrimination against carbon 13 (\(\Delta\ce{^{13}C}\), permil) including photorespiration.Delta14C: discrimination against carbon 14 (\(\Delta\ce{^{14}C}\), permil) including photorespiration.d13C_leaf: isotopic ratio of carbon 13 in leaves (\(\delta\ce{^{13}C}\), permil).d14C_leaf: isotopic ratio of carbon 14 in leaves (\(\delta\ce{^{14}C}\), permil).d13C_wood: isotopic ratio of carbon 13 in wood (\(\delta\ce{^{13}C}\), permil), given a parameterized post-photosynthetic fractionation.
The calculations differ between C3 and C4 plants, and this is set by the selection of
the method_optchi argument used for the PModel
instance.
carb_c3 = CarbonIsotopes(mod_c3, d13CO2=-8.4, D14CO2=19.2)
carb_c3.summarize()
CarbonIsotopes(shape=(31,), method=False)
Attr               Mean     Min     Max    NaN  Units
---------------  ------  ------  ------  -----  -------
Delta13C_simple   19.42   11.25   26.17      0  permil
Delta13C          17.82   10.8    22.62      0  permil
Delta14C          35.65   21.6    45.23      0  permil
d13C_leaf        -25.75  -30.33  -19         0  permil
d14C_leaf        -15.83  -24.91   -2.35      0  permil
d13C_wood        -23.65  -28.23  -16.9       0  permil
carb_c4 = CarbonIsotopes(mod_c4, d13CO2=-8.4, D14CO2=19.2)
carb_c4.summarize()
CarbonIsotopes(shape=(31,), method=True)
Attr               Mean     Min    Max    NaN  Units
---------------  ------  ------  -----  -----  -------
Delta13C_simple    7.17    1.45  11.88      0  permil
Delta13C           7.17    1.45  11.88      0  permil
Delta14C          14.35    2.91  23.77      0  permil
d13C_leaf        -15.45  -20.04  -9.84      0  permil
d14C_leaf          4.83   -4.46  16.25      0  permil
d13C_wood        -13.35  -17.94  -7.74      0  permil
The plots below show how the calculated values alter with \(\chi\). The differences in the direction of these relationships between C3 and C4 pathways creates a predictable isotopic signature of relative contributions of the two pathways.