\(J_{max}\) limitation
Run this notebook
Read the guide on setting up your computer to run Jupyter notebooks
Download
this notebookas a Jupyter notebook.
Environmental conditions can also lead to limitation of both the electron transfer rate
(\(J_{max}\)) and the carboxylation capacity (\(V_{cmax}\)) of leaves. The
jmax_limitation module implements three alternative approaches
to the calculation of \(J_{max}\) and \(V_{cmax}\) and these are specified when fitting a P
Model using the argument method_jmaxlim.
These options implement alternative calculations of two factor (\(f_j\) and \(f_v\)) which are applied to the calculation of \(J_{max}\) and \(V_{cmax}\). The options for this setting are:
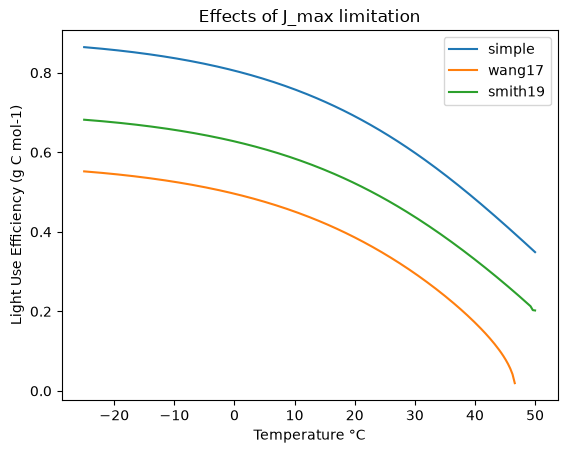
none: This approach implements \(f_j = f_v = 1\) and hence no limitation.wang17: This is the default setting formethod_jmaxlimand applies the calculations describe in Wang et al. (2017). The calculation details can be seen in theJmaxLimitationWang17method.smith19: This is an alternate calculation for optimal values of \(J_{max}\) and \(V_{cmax}\) described in Smith et al. (2019). The calculation details can be seen in theJmaxLimitationSmith19method.
The plot below shows the effects of each method on the light use efficienct across a temperature gradient. The other forcing variables are fixed (\(P=101325.0 , \ce{CO2}= 400 \text{ppm}, \text{VPD}=820\)) and \(\phi_0\) is also fixed (\(\phi_0=0.08\)).
/home/docs/checkouts/readthedocs.org/user_builds/pyrealm/checkouts/latest/pyrealm/pmodel/pmodel.py:481: UserWarning:
            The default value for quantum yield of photosynthesis (phi0=1/8) has changed
            since pyrealm 1.0.0. You may need to change settings to duplicate results
            from pyrealm 1.0.0.

  warn(