The T Model module
Run this notebook
Read the guide on setting up your computer to run Jupyter notebooks
Download
this notebookas a Jupyter notebook.
import warnings

from matplotlib import pyplot as plt
import numpy as np
import pandas as pd

from pyrealm.core.experimental import ExperimentalFeatureWarning
from pyrealm.demography.flora import Flora
from pyrealm.demography.cohorts import create_cohorts, cohort_id_generator
from pyrealm.demography.tmodel import (
    StemAllocation,
    StemAllometry,
    GrowthIncrements,
    calculate_whole_crown_gpp,
)

warnings.filterwarnings(
    "ignore",
    category=ExperimentalFeatureWarning,
)
The T Model also predicts how gross primary productivity (GPP) will be allocated to
respiration, turnover and growth for stems with a given PFT and allometry using the
StemAllometry() class. We first need a set of cohorts
and their stem allometry:
# Create a flora with 3 PFTs with different maximum heights
flora = Flora(name=["short", "medium", "tall"], h_max=[10, 20, 30])

# Create an id generator.
cid_generator = cohort_id_generator(mode="str")

# Create the cohorts
cohorts = create_cohorts(
    flora=flora,
    cid_generator=cid_generator,
    pft_name=np.array(["short", "medium", "tall"]),
    dbh_value=np.array([0.1, 0.1, 0.1]),
    n_individuals=np.array([1, 1, 1]),
)

allometry = StemAllometry(cohorts=cohorts)
Carbon Allocation
This requires an estimate of the GPP available to a stem. The original implementation of the T Model implemented this (Equation 12, Li et al., 2014) using an estimate of the potential GPP per square metre (\(P_0\)), scaled up to the crown area of the stem (\(A_c\)) and using the Beer-Lambert equation to estimate the proportion of potential GPP captured by the crown as a function of the canopy light extinction coefficient (\(k\)) and the canopy leaf area index (\(L\)):
This is implemented in the function calculate_whole_crown_gpp:
whole_crown_gpp = calculate_whole_crown_gpp(
    potential_gpp=np.array([55]),
    crown_area=allometry.crown_area,
    par_ext=cohorts.par_ext,
    lai=cohorts.lai,
)
print(whole_crown_gpp)
0    59.232054
1    75.943478
2    83.004957
dtype: float64
Those realised stem GPP values can then be provided to the StemAllocation class:
allocation = StemAllocation(
    cohorts=cohorts,
    allometry=allometry,
    whole_crown_gpp=whole_crown_gpp.to_numpy(),
)
allocation
StemAllocation: Values for 3 cohorts
The to_dataframe() method can be
used to export data for exploration.
allocation.to_dataframe().transpose()
| 0 | 1 | 2 | |
|---|---|---|---|
| cohort_ids | C_000000 | C_000001 | C_000002 |
| whole_crown_gpp | 59.232054 | 75.943478 | 83.004957 |
| sapwood_respiration | 0.197715 | 0.28648 | 0.322778 |
| foliage_respiration | 5.923205 | 7.594348 | 8.300496 |
| fine_root_respiration | 0.50701 | 0.650055 | 0.7105 |
| foliage_turnover | 0.058332 | 0.07479 | 0.081744 |
| fine_root_turnover | 0.533965 | 0.684615 | 0.748272 |
| branch_turnover | 0.0 | 0.0 | 0.0 |
| npp | 31.562474 | 40.447557 | 44.20271 |
The allocation values shown above can then be used to calculate growth increments, as described in the T Model overview:
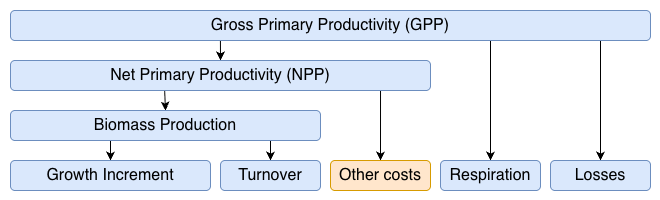
Under the original T Model, all of the NPP is allocated to biomass production and the
GrowthIncrements class can be used to calculate the growth increments after accounting
for turnover. The original implementation of the T Model did not include branch turnover
and the default PFT parameterisation sets branch turnover to zero.
growth = GrowthIncrements(
    cohorts=cohorts, allometry=allometry, stem_allocation=allocation
)
growth
GrowthIncrements: Values for 3 cohorts
growth.to_dataframe().transpose()
| 0 | 1 | 2 | |
|---|---|---|---|
| cohort_ids | C_000000 | C_000001 | C_000002 |
| delta_dbh | 0.208607 | 0.191874 | 0.186059 |
| delta_stem_mass | 28.453546 | 36.31641 | 39.632111 |
| delta_foliage_mass | 0.744565 | 0.997557 | 1.106681 |
| delta_fine_root_mass | 1.772066 | 2.374186 | 2.633901 |
If you want to incorporate other costs into NPP - decreasing carbon available for
biomass production - the GrowthIncrements class has an optional biomass_production
argument:
# Reduce estimated NPP by 10% to allocate carbon to other costs
biomass_production = allocation.npp * 0.9
reduced_growth = GrowthIncrements(
    cohorts=cohorts,
    allometry=allometry,
    stem_allocation=allocation,
    biomass_production=biomass_production,
)
reduced_growth.to_dataframe().transpose()
| 0 | 1 | 2 | |
|---|---|---|---|
| cohort_ids | C_000000 | C_000001 | C_000002 |
| delta_dbh | 0.187347 | 0.172319 | 0.167097 |
| delta_stem_mass | 25.553774 | 32.615281 | 35.593057 |
| delta_foliage_mass | 0.668685 | 0.895893 | 0.993895 |
| delta_fine_root_mass | 1.59147 | 2.132224 | 2.365471 |
Allocation profiles
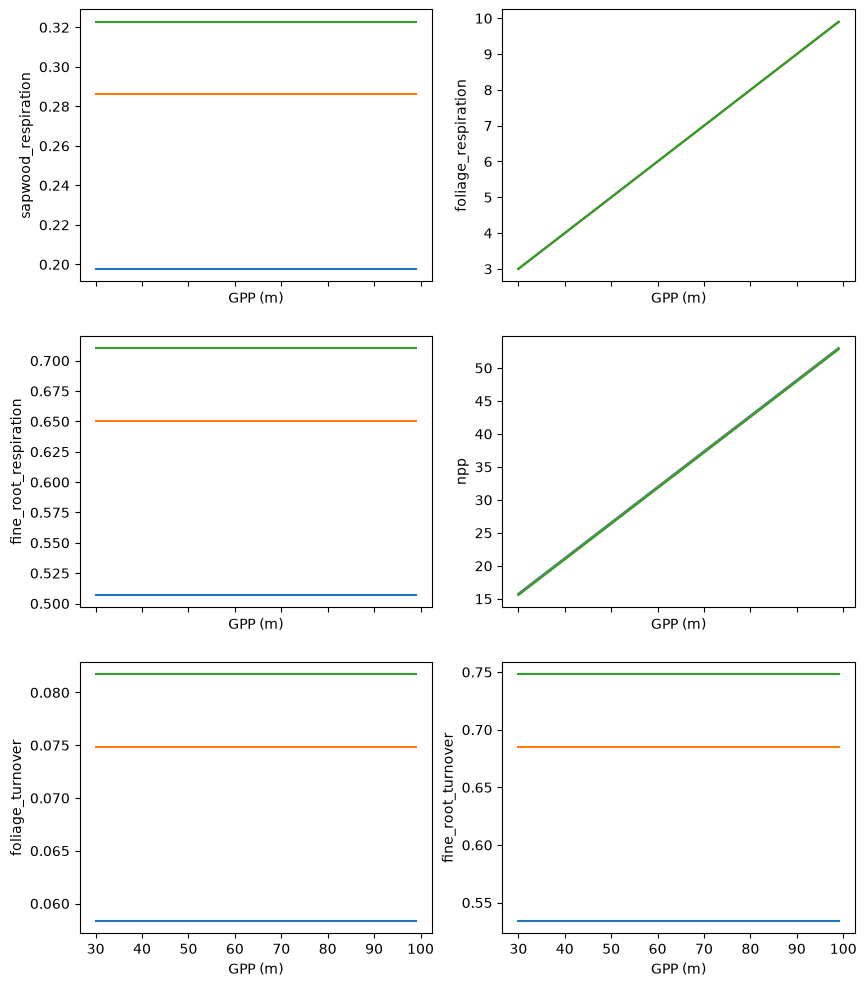
As with the StemAllometry, the StemAllocation class can be used to generate a
profile of the allocation predictions for different estimates of potential GPP. The
profile=True option is used to indicate that - instead of providing a single GPP
estimate for each cohort - you want predictions at each GPP estimate for each cohort.
# Calculate the stem GPP from potential GPP following the Li et al model
whole_crown_gpp_profile = np.arange(30, 100)

# Calculate the T Model allocation of those GPP values
allocation_profile = StemAllocation(
    cohorts=cohorts,
    allometry=allometry,
    whole_crown_gpp=whole_crown_gpp_profile,
    profile=True,
)
allocation_profile
StemAllocation: Profiles for 3 cohorts at 70 GPP values.
fig, axes = plt.subplots(ncols=2, nrows=3, sharex=True, figsize=(10, 12))

plot_details = [
    ("sapwood_respiration", "sapwood_respiration"),
    ("foliage_respiration", "foliage_respiration"),
    ("fine_root_respiration", "fine_root_respiration"),
    ("npp", "npp"),
    ("foliage_turnover", "foliage_turnover"),
    ("fine_root_turnover", "fine_root_turnover"),
]

axes = axes.flatten()

for ax, (var, ylab) in zip(axes, plot_details):
    ax.plot(whole_crown_gpp_profile, getattr(allocation_profile, var), label=flora.name)
    ax.set_xlabel("GPP (m)")
    ax.set_ylabel(ylab)

    if var == "whole_crown_gpp":
        ax.legend(frameon=False)
Again, with GPP profiles, the
to_dataframe() method stacks
predictions into columns identified by pairings of cohort ID and DBH.
allocation_profile.to_dataframe().head(6)[["cohort_ids", "whole_crown_gpp", "npp"]]
| cohort_ids | whole_crown_gpp | npp | |
|---|---|---|---|
| 0 | C_000000 | 30.0 | 15.777165 |
| 1 | C_000001 | 30.0 | 15.638079 |
| 2 | C_000002 | 30.0 | 15.580033 |
| 3 | C_000000 | 31.0 | 16.317165 |
| 4 | C_000001 | 31.0 | 16.178079 |
| 5 | C_000002 | 31.0 | 16.120033 |