Hygrometric functions
Run this notebook
Read the guide on setting up your computer to run Jupyter notebooks
Download
this notebookas a Jupyter notebook.
# This code loads required packages and then creates a representative range of
# values of the core variables to use in function plots.
#
# Note that the ranges are created (`_1d`) but are also cast to two dimensional
# arrays of repeating values (`_2d`) to generate response surfaces for functions
# with multiple inputs.

from matplotlib import pyplot
import numpy as np
from pyrealm.core import hygro

%matplotlib inline

# Set the resolution of examples
n_pts = 101

# Create a range of representative values for key inputs.
tc_1d = np.linspace(0, 60, n_pts)
vp_1d = np.linspace(0, 20, n_pts)
rh_1d = np.linspace(0, 1, n_pts)
sh_1d = np.linspace(0, 0.02, n_pts)

# Broadcast the range into arrays with repeated values.
tc_2d = np.broadcast_to(tc_1d, (n_pts, n_pts))
vp_2d = np.broadcast_to(vp_1d, (n_pts, n_pts))
rh_2d = np.broadcast_to(rh_1d, (n_pts, n_pts))
The PModelEnvironment class requires
vapour pressure
deficit (VPD, Pa) as an input, but forcing datasets often provide alternative
representations. The hygro provide functions to calculate
saturated
vapour pressure for a given temperature and the conversions from vapour pressure,
relative humidity and specific humidity to vapour pressure deficit.
Vapour Pressure and units
It is common to use data on Vapour Pressure (VP) to calculate Vapour Pressure Deficit (VPD). It is now usual for VP to be provided in kilopascals (kPa) but some older data sources use hectopascals (hPa), which are equivalent to millibars (mb or mbar).
The function convert_vp_to_vpd() takes values in kPa
and returns kPa, so if you are using VP to prepare input data for
PModelEnvironment:
Make sure you are passing VP values to
convert_vp_to_vpd()in kPa and not hPa or mbar.Rescale the output of
convert_vp_to_vpd()from kPa to Pa, before using it inPModelEnvironment.
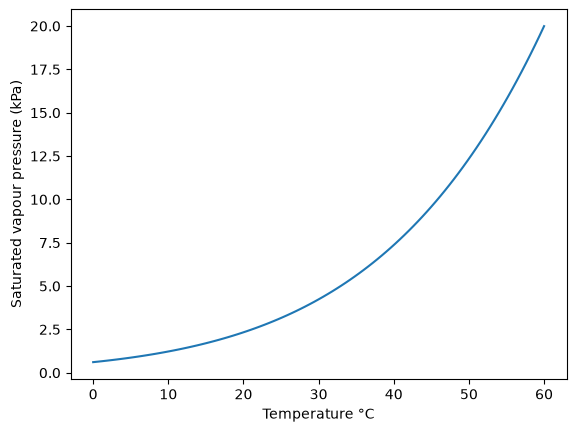
Saturated vapour pressure
# Create a sequence of air temperatures and calculate the saturated vapour pressure
vp_sat = hygro.calculate_vp_sat(tc=tc_1d)

# Plot ta against vp_sat
pyplot.plot(tc_1d, vp_sat)
pyplot.xlabel("Temperature °C")
pyplot.ylabel("Saturated vapour pressure (kPa)")
pyplot.show()
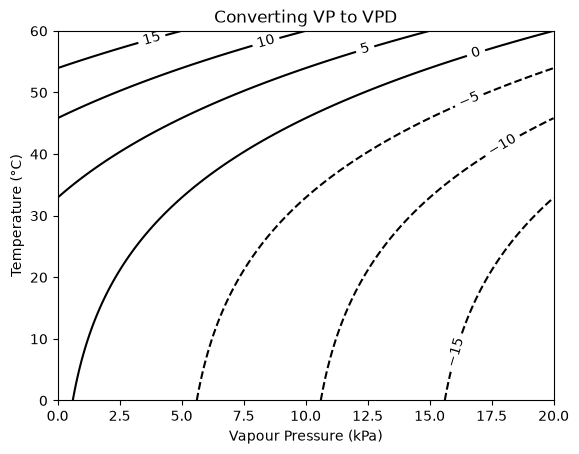
Vapour pressure to VPD
vpd = hygro.convert_vp_to_vpd(vp=vp_2d, tc=tc_2d.transpose())

# Plot vpd
fig, ax = pyplot.subplots()
CS = ax.contour(vp_1d, tc_1d, vpd, colors="black")
ax.clabel(CS, inline=1, fontsize=10)
ax.set_title("Converting VP to VPD")
ax.set_xlabel("Vapour Pressure (kPa)")
ax.set_ylabel("Temperature (°C)")
pyplot.show()
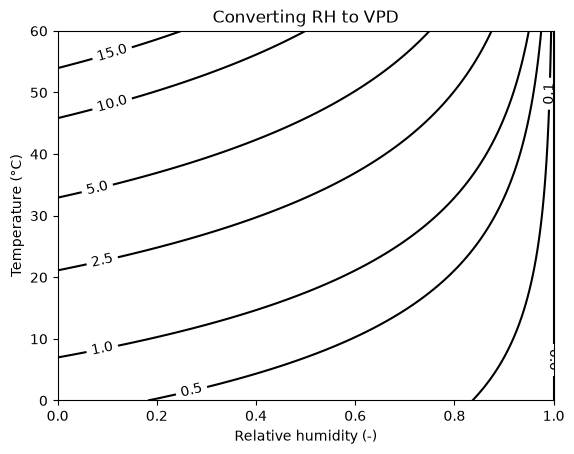
Relative humidity to VPD
vpd = hygro.convert_rh_to_vpd(rh=rh_2d, tc=tc_2d.transpose())

# Plot vpd
fig, ax = pyplot.subplots()
CS = ax.contour(
    rh_1d, tc_1d, vpd, colors="black", levels=[0, 0.1, 0.5, 1, 2.5, 5, 10, 15]
)
ax.clabel(CS, inline=1, fontsize=10)
ax.set_title("Converting RH to VPD")
ax.set_xlabel("Relative humidity (-)")
ax.set_ylabel("Temperature (°C)")
pyplot.show()
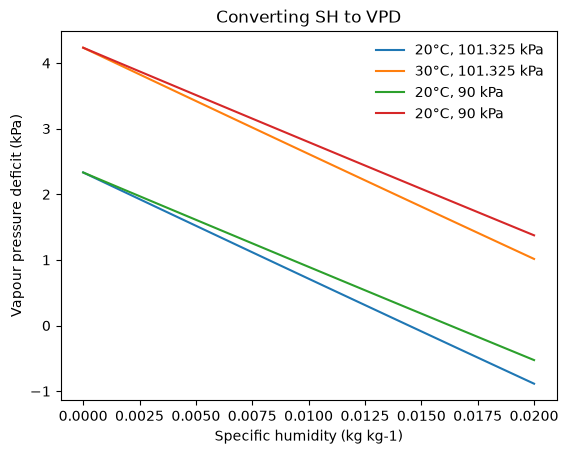
Specific humidity to VPD
# Create a sequence of air temperatures and calculate the saturated vapour pressure
vpd1 = hygro.convert_sh_to_vpd(sh_1d, tc=20, patm=101.325)
vpd2 = hygro.convert_sh_to_vpd(sh_1d, tc=30, patm=101.325)
vpd3 = hygro.convert_sh_to_vpd(sh_1d, tc=20, patm=90)
vpd4 = hygro.convert_sh_to_vpd(sh_1d, tc=30, patm=90)


for yvals, lab in zip(
    [vpd1, vpd2, vpd3, vpd4],
    ["20°C, 101.325 kPa", "30°C, 101.325 kPa", "20°C, 90 kPa", "20°C, 90 kPa"],
):
    pyplot.plot(sh_1d, yvals, label=lab)

pyplot.title("Converting SH to VPD")
pyplot.legend(frameon=False)
pyplot.xlabel("Specific humidity (kg kg-1)")
pyplot.ylabel("Vapour pressure deficit (kPa)")
pyplot.show()