Isotopic discrimination
The worked example from this page
can be downloaded as Jupyter notebook here.
C3 and C4 plants assimilate the heavier atmospheric \(\ce{^{13}CO2}\) and \(\ce{^{14}CO2}\) molecules less easily than \(\ce{^{12}CO2}\), leading to a discrimination against carbon 13 and carbon 14 and alteration of the resulting isotopic composition of plant tissues. The isotopic discrimination and associated isotopic composition of a plant material depends on the photosynthetic pathway.
The pmodel module provides the
CalcCarbonIsotopes class, which takes the predicted
optimal chi (\(\chi\)) and photosynthetic pathway from a fitted
PModel instance and predicts various isotopic
discrimination and composition values.
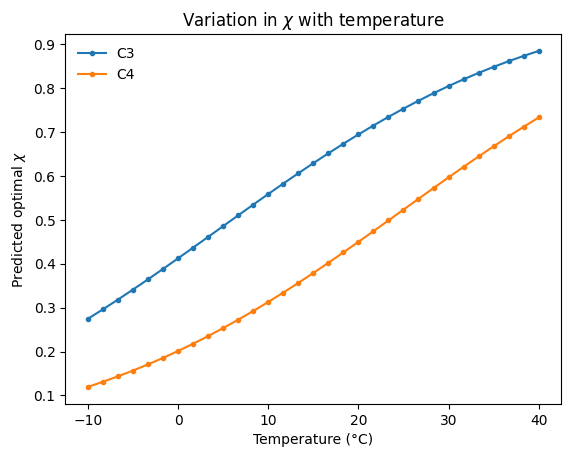
The predictions from the CalcCarbonIsotopes class are
driven by variation in \(\chi\). The examples below show predictions across a range of
values of \(\chi\). The sequence of \(\chi\) values used is created by using the P Model to
estimate \(\chi\) across a temperature gradient, giving the range of \(\chi\) values shown
below for C3 and C4 plants.
pyrealm/pmodel.py:409: UserWarning:
    Pyrealm 2.0.0 uses a new default for the quantum yield of photosynthesis (phi0=1/8).
    You may need to change settings to duplicate results from pyrealm 1.0.0.
Calculation of values
The CalcCarbonIsotopes class takes a
PModel instance, along with estimates of the atmospheric
isotopic ratios for Carbon 13 (\(\delta13C\), permil) and Carbon 14 (\(\Delta14C\), permil)
and calculates the following predictions:
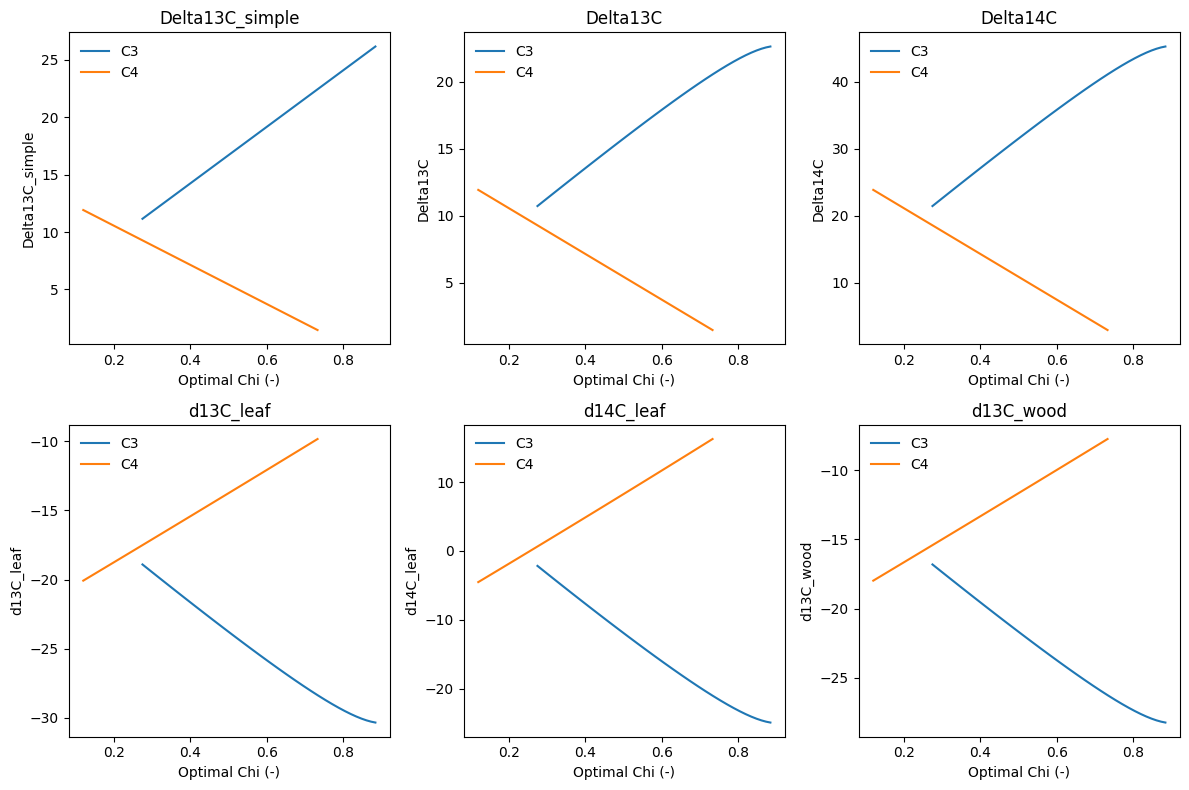
Delta13C_simple: discrimination against carbon 13 (\(\Delta\ce{^{13}C}\), permil) excluding photorespiration.Delta13C: discrimination against carbon 13 (\(\Delta\ce{^{13}C}\), permil) including photorespiration.Delta14C: discrimination against carbon 14 (\(\Delta\ce{^{14}C}\), permil) including photorespiration.d13C_leaf: isotopic ratio of carbon 13 in leaves (\(\delta\ce{^{13}C}\), permil).d14C_leaf: isotopic ratio of carbon 14 in leaves (\(\delta\ce{^{14}C}\), permil).d13C_wood: isotopic ratio of carbon 13 in wood (\(\delta\ce{^{13}C}\), permil), given a parameterized post-photosynthetic fractionation.
The calculations differ between C3 and C4 plants, and this is set by the selection of
the method_optchi argument used for the PModel
instance.
carb_c3 = CalcCarbonIsotopes(mod_c3, d13CO2=-8.4, D14CO2=19.2)
carb_c3.summarize()
CalcCarbonIsotopes(shape=(31,), method=False)
Attr               Mean     Min     Max    NaN  Units
---------------  ------  ------  ------  -----  -------
Delta13C_simple   19.4    11.15   26.16      0  permil
Delta13C          17.81   10.71   22.61      0  permil
Delta14C          35.62   21.42   45.23      0  permil
d13C_leaf        -25.74  -30.33  -18.91      0  permil
d14C_leaf        -15.8   -24.9    -2.17      0  permil
d13C_wood        -23.64  -28.23  -16.81      0  permil
carb_c4 = CalcCarbonIsotopes(mod_c4, d13CO2=-8.4, D14CO2=19.2)
carb_c4.summarize()
CalcCarbonIsotopes(shape=(31,), method=True)
Attr               Mean     Min    Max    NaN  Units
---------------  ------  ------  -----  -----  -------
Delta13C_simple    7.18    1.46  11.92      0  permil
Delta13C           7.18    1.46  11.92      0  permil
Delta14C          14.36    2.91  23.83      0  permil
d13C_leaf        -15.46  -20.08  -9.84      0  permil
d14C_leaf          4.81   -4.52  16.24      0  permil
d13C_wood        -13.36  -17.98  -7.74      0  permil
The plots below show how the calculated values alter with \(\chi\). The differences in the direction of these relationships between C3 and C4 pathways creates a predictable isotopic signature of relative contributions of the two pathways.